
How have NOTDEC UK figures changed over the years?
Answer
 Yes: a lot!
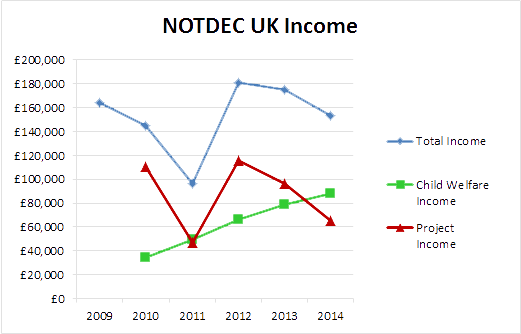
Child Welfare Income is money given via child sponsorship or as lumps sums for the day-to-day needs of the children (food etc.) and all the routine running costs of the orphanage including staff. It does not cover building the orphanage, nor the capital cost of buying vehicles like the school bus and the tractor for hauling water, or computers for the orphanage office. All these and a whole host of other non-welfare costs are met out of Project Income — so called because the first task was to pay for the building project that produced the first four bungalows.
Project Income and Expenditure have bounced around considerably — reflecting particularly the various phases of construction at the orphanage — and have taken Total Income and Expenditure up and down with them. We do, however, accrue funds for maintenance and renewals.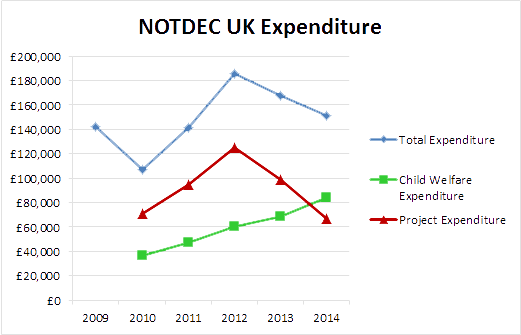
By contrast, both Child Welfare Income and Expenditure were much more stable, though with a marked upward trend.
Total Income was low in 2011 because Project Income in that year was also down. That was because Project Income the previous year had greatly exceeded Project Expenditure, producing a very healthy surplus. However, Project Expenditure in 2011 substantially exceeded Project Income, and so quickly disposed of the surplus! NOTDEC does not ask for large sums for which it had no immediate need or for future unspecified projects.
| Financial Year | 2009 | 2010 | 2011 | 2012 | 2013 | 2014 | 2015 |
|---|---|---|---|---|---|---|---|
| Total Income | £164,050 | £144,965 | £96,276 | £181,505 | £175,347 | £153,370 | n/a |
| Child Welfare Income | n/a | £34,690 | £49,597 | £66,207 | £79,183 | £88,108 | n/a |
| Project Income | n/a | £110,275 | £46,679 | £115,298 | £96,164 | £65,062 | n/a |
| Travel Donations | n/a | £7,055 | £5,883 | £11,632 | £6,646 | £9,609 | n/a |
| Project Standing Orders | £4,348 | £8,088 | £8,048 | £3,444 | £7,945 | £7,560 | n/a |
| FInancial Year | 2009 | 2010 | 2011 | 2012 | 2013 | 2014 | 2015 |
|---|---|---|---|---|---|---|---|
| Total Expenditure | £142,612 | £107,193 | £141,732 | £185,573 | £167,480 | £151,435 | n/a |
| Child Welfare Expenditure | n/a | £36,469 | £47,010 | £60,700 | £68,650 | £84,165 | n/a |
| Project Expenditure | n/a | £70,724 | £94,722 | £124,873 | £98,830 | £67,270 | n/a |
| Bank Charges | n/a | £425 | £360 | £440 | £400 | £494 | n/a |
| Printing & Publicity | n/a | £866 | £0 | £674 | £140 | £13 | n/a |
| Travel | n/a | £7.055 | £5,883 | £11,632 | £6,646 | £9,609 | n/a |
| Equipment & Services | n/a | £13,478 | £7,564 | £6127 | £20,644 | £19,529 | n/a |
| Construction, Vehicles etc. | n/a | £48,900 | £80,915 | £106,000 | £71,000 | £37,625 | n/a |